AlgPred:
PREDICTION OF ALLERGENIC PROTEINS AND MAPPING OF IgE EPITOPES
Sudipto Saha and G. P. S.
Raghava*
Institute of Microbial
Technology, Sector-39A, Chandigarh, India
Running
Tite: Allergens prediction
Address correspondence to:
Dr. G. P. S. Raghava, Scientist, Bioinformatics Centre Institute of Microbial
Technology Sector 39A,
Chandigarh, INDIA, Phone: +91-11-26907444; Fax: +91-172-2690632 E-mail: raghava@iiitd.ac.in
Available
at : http://webs.iiitd.edu.in/raghava/algpred
Supplemental data
Dataset
The protein sequence sets used in this study are publicly available on http://www.slv.se/templatesSLV/SLV_Page____9343.asp
(Bjorklund et al., 2005). The dataset contains 578 experimental allergens
and 700 non allergens protein sequences derived from food. We obtained IgE
epitope from SDAP and Bcipep database.
The
performance of SVM module based on dipeptide composition
The following table demonstrates the performance of SVM based method using dipeptide composition. The RBF kernel was used and the values are g=100; c=1; and j=1.
Table S1: Performance of
SVM based method using dipeptide composition
|
Threshold |
Sensitivity |
Specificity |
Accuracy |
PPV |
NPV |
MCC |
|
1.0 |
0.0957 |
1.0000 |
0.5922 |
1.0000 |
0.5742 |
0.2346 |
|
0.8 |
0.1791 |
1.0000 |
0.6298 |
1.0000 |
0.5978 |
0.3275 |
|
0.6 |
0.2696 |
0.9886 |
0.6643 |
0.9509 |
0.6229 |
0.3852 |
|
0.4 |
0.3913 |
0.9686 |
0.7082 |
0.9109 |
0.6602 |
0.4538 |
|
0.2 |
0.5461 |
0.9429 |
0.7639 |
0.8870 |
0.7174 |
0.5441 |
|
0.0 |
0.7043 |
0.9100 |
0.8173 |
0.8654 |
0.7903 |
0.6353 |
|
-0.2 |
0.8278 |
0.8500 |
0.8400 |
0.8193 |
0.8586 |
0.6786 |
|
-0.4 |
0.8922 |
0.7743 |
0.8275 |
0.7645 |
0.8988 |
0.6657 |
|
-0.6 |
0.9374 |
0.6771 |
0.7945 |
0.7046 |
0.9312 |
0.6259 |
|
-0.8 |
0.9600 |
0.5657 |
0.7435 |
0.6449 |
0.9474 |
0.5589 |
|
-1.0 |
0.9757 |
0.4471 |
0.6855 |
0.5918 |
0.9601 |
0.4840 |
The performance of Hybrid approach using SVM based on dipeptide composition and IgE
based approach
The following table shows the performance of hybrid approach, which combines SVM module based on dipeptide composition and IgE epitope based approach(PID865). A protein is assigned as allergen if predicted allergen by IgE method (PID865) and also have SVM score ³ -0.5 or protein is assigned allegen or non allergen using SVM approach, when protein have no similarity with known IgE epitopes. The table shows that one might achieve better sensitivity without loosing much specificity at higher threshold.
TableS2:
The performance of hybrid approach, which combines SVM based approach using
dipeptide composition and IgE epitope based approach (PID865).
|
Threshold |
Sensitivity |
Specificity |
Accuracy |
PPV |
NPV |
MCC |
|
1.0 |
0.2296 |
0.9943 |
0.6494 |
0.9706 |
0.6116 |
0.3613 |
|
0.8 |
0.3043 |
0.9943 |
0.6831 |
0.9777 |
0.6356 |
0.4283 |
|
0.6 |
0.3878 |
0.9829 |
0.7145 |
0.9489 |
0.6622 |
0.4764 |
|
0.4 |
0.4922 |
0.9643 |
0.7514 |
0.9188 |
0.6988 |
0.5314 |
|
0.2 |
0.6104 |
0.9386 |
0.7906 |
0.8909 |
0.7466 |
0.5922 |
|
0.0 |
0.7322 |
0.9057 |
0.8275 |
0.8645 |
0.8056 |
0.6544 |
|
-0.2 |
0.8365 |
0.8457 |
0.8416 |
0.8166 |
0.8642 |
0.6823 |
|
-0.4 |
0.8957 |
0.7743 |
0.8290 |
0.7652 |
0.9018 |
0.6693 |
|
-0.6 |
0.9374 |
0.6771 |
0.7945 |
0.7046 |
0.9312 |
0.6259 |
|
-0.8 |
0.9600 |
0.5657 |
0.7435 |
0.6449 |
0.9474 |
0.5589 |
|
-1.0 |
0.9757 |
0.4471 |
0.6855 |
0.5918 |
0.9601 |
0.4840 |
The performance
of hybrid approach, which combines SVM based approach using amino
acid composition and motif based approach (MEME ev 0.1).
The following table shows the performance of hybrid approach using SVM based approach using amino acid
composition and motif based approach (MEME ev 0.1). No improvement was
observed.
Table S3: The performance of hybrid approach,
which combines SVM based approach using amino acid composition and motif based
approach (MEME ev 0.1).
|
Threshold |
Sensitivity |
Specificity |
Accuracy |
PPV |
NPV |
MCC |
|
1.0 |
0.4504 |
0.8986 |
0.6965 |
0.7848 |
0.6663 |
0.3973 |
|
0.8 |
0.5270 |
0.8871 |
0.7247 |
0.7932 |
0.6962 |
0.4507 |
|
0.6 |
0.6087 |
0.8757 |
0.7553 |
0.8009 |
0.7324 |
0.5088 |
|
0.4 |
0.6661 |
0.8571 |
0.7710 |
0.7930 |
0.7585 |
0.5378 |
|
0.2 |
0.7235 |
0.8443 |
0.7898 |
0.7924 |
0.7891 |
0.5752 |
|
0.0 |
0.7948 |
0.8186 |
0.8078 |
0.7825 |
0.8304 |
0.6139 |
|
-0.2 |
0.8748 |
0.7900 |
0.8282 |
0.7738 |
0.8862 |
0.6632 |
|
-0.4 |
0.9130 |
0.7557 |
0.8267 |
0.7543 |
0.9152 |
0.6699 |
|
-0.6 |
0.9252 |
0.7000 |
0.8016 |
0.7170 |
0.9211 |
0.6324 |
|
-0.8 |
0.9565 |
0.6414 |
0.7835 |
0.6866 |
0.9493 |
0.6175 |
|
-1.0 |
0.9670 |
0.5657 |
0.7467 |
0.6465 |
0.9565 |
0.5677 |
The performance of various methods on Independent dataset
The following table shows the performance of various approaches on independent dataset of 664 allergens obtained from Li et al., 2004 and dataset of 323 proteins, which excludes all those proteins found in Bjorklund et al., 2005. Here, SVMc =SVM based on amino acid compsition; SVMd =SVM based on dipeptide composition; * PID865
Table S4: The performance of various approaches on independent dataset
Methods
|
Sensitivity
or percent coverage
|
|
|
664 allergens |
323 allergens |
|
|
SVMc |
88.25 |
84.21 |
|
SVMd |
89.46 |
84.82 |
|
IgE epitope* |
14.78 |
10.83 |
|
Mast |
12.65 |
12.38 |
|
ARPs Blast (e-value .001) |
83.58 |
66.56 |
|
SVMc + IgE epitope (PID865) |
88.86 |
84.83 |
|
SVMd + IgE epitope |
90.06 |
85.14 |
|
SVMc+IgE epitope+Mast |
89.61 |
85.76 |
|
SVMd+IgE epitope+Mast |
90.66 |
85.76 |
|
SVMc+IgE epitope +Mast +BLAST |
96.84 |
93.5 |
|
SVMd+IgE epitope+Mast +BLAST |
96.08 |
92.26 |
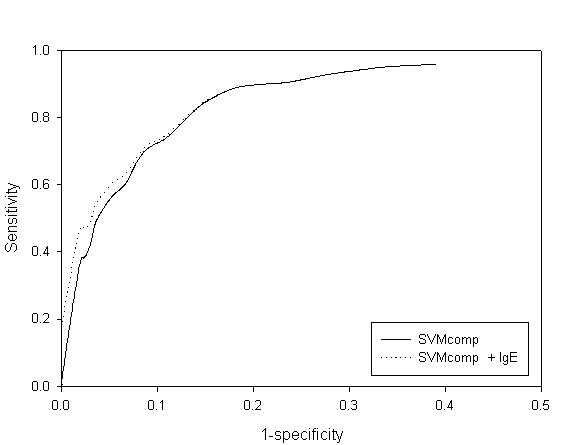
Fig. S1 ROC plot of SVM amino acid and combined approach
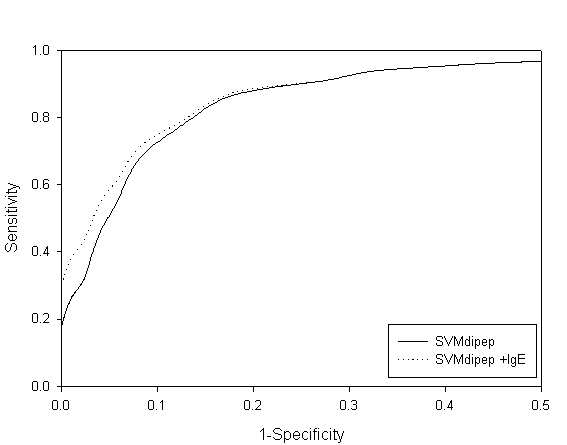
Fig. S2 ROC plot of SVM dipeptide and combined approach
Development of IgE
epitope prediction method
There were 183 epitopes collected from SDAP and Bcipep. We examined all the epitope length and their frequency and found epitope length varied from 4 to 22 mers. There were 67 epitopes with 10 mers length, which was the highest frequency. So, we tried to develop a method based on this 67 epitopes and obtained 67 random peptide of 10 mers from nonallergen database (obtained from consumed commodities, such as rice, apple, milk,etc.).
We tried SVM method based on amino acid composition and sequence information and used five fold cross validation technique (four training set and one testing set).
1. SVM method based on amino acid composition
RBF kernel g=.01 c=1000 j=1
|
Thres
Sen Spe Acc
PPV MCC |
|
1.0000 0.2154 0.8769 0.5462 0.7100
0.1412 |
|
0.8000 0.2769 0.8462 0.5615 0.7200
0.1691 |
|
0.6000 0.3077 0.8154 0.5615 0.6879
0.1626 |
|
0.4000 0.4000 0.7077 0.5538 0.5734
0.1123 |
|
0.2000 0.5231 0.6308 0.5769 0.5939
0.1577 |
|
0.1000 0.6000 0.6154 0.6077
0.6159 0.2173 |
|
0.0000 0.6154 0.5538 0.5846 0.5876
0.1720 |
|
-0.2000 0.6615 0.4308 0.5462 0.5436
0.0885 |
|
-0.4000 0.7077 0.3692 0.5385 0.5321
0.0765 |
|
-0.6000 0.8000 0.2769 0.5385 0.5225
0.0997 |
|
-0.8000 0.8462 0.2154 0.5308 0.5172
0.0912 |
|
-1.0000 0.7385 0.1846 0.4615 0.4360
0.1821 |
Thres= Threshold; Sen=Sensitivity; Spe=Specificity; Acc=Accuracy; PPV= Positive prediction value; MCC= Mathews correlation coefficient
2. SVM method based on sequence information
RBF
kernel g=.01 c=10 j=1
|
Thres
Sen Spe Acc
PPV MCC |
|
1.0000 0.0308 0.3692 0.2000 0.2667
0.0159 |
|
0.8000 0.0462 0.5231 0.2846 0.2500
-0.0426 |
|
0.6000 0.0462 0.5231 0.2846 0.2500
-0.0426 |
|
0.4000 0.1538 0.8154 0.4846
0.5090 -0.0222 |
|
0.2000 0.2615 0.6769 0.4692 0.4504
-0.0667 |
|
0.0000 0.3692 0.5692 0.4692 0.4611
-0.0627 |
|
-0.2000 0.5231 0.4769 0.5000 0.5014
-0.0008 |
|
-0.4000 0.6615 0.2615 0.4615 0.4737
-0.0867 |
|
-0.6000 0.6462 0.1692 0.4077 0.4038
0.0253 |
|
-0.8000 0.6615 0.1077 0.3846 0.3900
-0.0365 |
|
-1.0000 0.7385 0.0615 0.4000 0.4000
0.0000 |
Thres= Threshold; Sen=Sensitivity; Spe=Specificity; Acc=Accuracy; PPV= Positive prediction value; MCC= Mathews correlation coefficient
We also tried SNNS method (Feed forward network (FNN) and Recurrent neural network (RNN) ) based on amino acid cmposition and sequence information and used five fold cross validation technique (3 training set, one validation set, one testing set).
3. Feed forward neural network (hidden node 5) based on amino acid composition
|
Thres
Sen Spe Acc
PPV MCC |
|
1.0000 0.0000 0.0000 0.0000 0.0000
0.0000 |
|
0.8000 0.0000 0.0000 0.0000 0.0000
0.0000 |
|
0.7000 0.0000 0.0000 0.0000 0.0000
0.0000 |
|
0.6000 0.9538 0.2615 0.6077
0.5643 0.3028 |
|
0.5000 1.0000 0.0769 0.5385 0.5200
0.2000 |
|
0.4000 1.0000 0.0769 0.5385 0.5200
0.2000 |
|
0.2000 1.0000 0.0769 0.5385 0.5200
0.2000 |
|
0.0000 0.0000 0.0000 0.0000 0.0000
0.0000 |
|
-0.2000 0.0000 0.0000 0.0000 0.0000
0.0000 |
|
-0.4000 0.0000 0.0000 0.0000 0.0000
0.0000 |
|
-0.6000 0.0000 0.0000 0.0000 0.0000 0.0000 |
|
-0.8000 0.0000 0.0000 0.0000 0.0000
0.0000 |
|
-1.0000 0.0000 0.0000 0.0000 0.0000
0.0000 |
Thres= Threshold; Sen=Sensitivity; Spe=Specificity; Acc=Accuracy; PPV= Positive prediction value; MCC= Mathews correlation coefficient
4. Feed forward neural network (hidden node 5) based on sequence information
|
Thres
Sen Spe Acc
PPV MCC |
|
1.0000 0.0000 0.0000 0.0000 0.0000
0.0000 |
|
0.8000 0.0000 0.0000 0.0000 0.0000
0.0000 |
|
0.6000 0.2615 0.8769 0.5692 0.7033
0.1838 |
|
0.5000 0.6769 0.5846 0.6308 0.6319
0.2606 |
|
0.4000 0.8615 0.2615 0.5615 0.5377
0.1607 |
|
0.2000 1.0000 0.0769 0.5385 0.5200
0.2000 |
|
0.0000 0.0000 0.0000 0.0000 0.0000
0.0000 |
|
-0.2000 0.0000 0.0000 0.0000 0.0000
0.0000 |
|
-0.4000 0.0000 0.0000 0.0000 0.0000
0.0000 |
|
-0.6000 0.0000 0.0000 0.0000 0.0000
0.0000 |
|
-0.8000 0.0000 0.0000 0.0000 0.0000
0.0000 |
|
-1.0000 0.0000 0.0000 0.0000 0.0000
0.0000 |
Thres= Threshold; Sen=Sensitivity; Spe=Specificity; Acc=Accuracy; PPV= Positive prediction value; MCC= Mathews correlation coefficient
5. Recurrent neural network (Hidden node 5) based on Sequence information
|
Thres
Sen Spe Acc
PPV MCC |
|
1.0000 0.0000 0.0000 0.0000 0.0000
0.0000 |
|
0.8000 0.0000 0.0000 0.0000 0.0000
0.0000 |
|
0.6000 0.2000 0.7077 0.4538 0.5833
0.1520 |
|
0.5000 0.6154 0.6308 0.6231
0.6459 0.2474 |
|
0.4000 0.8615 0.2769 0.5692 0.5434
0.1752 |
|
0.2000 1.0000 0.0769 0.5385 0.5200
0.2000 |
|
0.0000 0.0000 0.0000 0.0000 0.0000
0.0000 |
|
-0.2000 0.0000 0.0000 0.0000 0.0000
0.0000 |
|
-0.4000 0.0000 0.0000 0.0000 0.0000
0.0000 |
|
-0.6000 0.0000 0.0000 0.0000 0.0000
0.0000 |
|
-0.8000 0.0000 0.0000 0.0000 0.0000
0.0000 |
|
-1.0000 0.0000 0.0000 0.0000 0.0000
0.0000 |
Thres= Threshold; Sen=Sensitivity; Spe=Specificity; Acc=Accuracy; PPV= Positive prediction value; MCC= Mathews correlation coefficient