Commonly used Bioinformatics Tools
This chapter describes commonly used computational techniques like machine learning. The aim of this chapter is not to describe theory of these methods. Instead we have describes how to use these programs. We have describes these methods in short and simple words, so begineers may use these tools. The detail description of these programs is available from their manual or web site. Following are commonly used tools, particularly our group is using them to build new tools.
Support Vector Machine: How to use SVMlight
SVM is frequently used in bioinformatics for classifying proteins, predicting structures, epitop prediction etc. One of the major advantages of SVM over other machine learning techniques is that it can be trained on small data set with minimum over-optimization. SVMlight is an implementation of Support vector Machines (SVMs) in C. SVMlight is an implementation of Vapnik’s Support Vector Machine for the problem of pattern recognition, for the problem of regression, and for the problem of learning a ranking function. The algorithm has scalable memory requirements and can handle problems with many thousand of support vectors efficiently. The software also provides methods for assessing the generalization performance efficiently. It includes two efficient estimation methods for both error rate and precision/recall.
How to use
SVMlight consists of a learning module (svm_learn) and a classification module (svm_classify). The classification module can be used to apply the learned model to new examples. See also the examples below for how to use svm_learn and svm_classify.
Run the svm_learn program with different parameters for better optimization
svm_learn [options] example_file model_file
svm_learn program build a model amd these model further use with svm_classify program.
1. By the use of svm_classify we can predict the class of unknown protein, whether it’s belongs to positive type or negative type.
svm_classify [options] example_file model_file output_file
svm_learn is called with the following parameters:
svm_learn [options] example_file model_file

Artificial Neural Network: How to use the SNNS for implementing ANN
ANN is powerful machine learning techniques, commonly used for solving classification problem. They are capable to handle large datasets and non-linear proroblems efficiently. SNNS (Stuttgart Neural Network Simulator) is a software simulator for neural networks on Unix workstations developed at the Institute for Parallel and Distributed High Performance Systems (IPVR) at the University of Stuttgart. The goal of the SNNS project is to create an efficient and flexible simulation environment for research on and application of neural nets. One of the challenges is to implement SNNS, here we have given an example
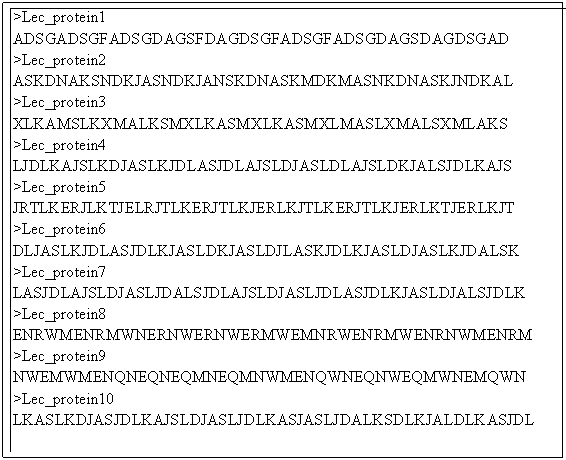
Input file in fasta format
Total number of sequence in this file is 78, only 10 are diplayed
An example of sequences in fasta format,
Input file in SNNS format
In order to generate fixed length pattern from variable length of sequence, we compute amino acid composition. Following is example input SNNS file generated for these sequences where composition is feature. Following is descriptrion
Note that the first 7 lines of the input file. First two lines , followed by to blank line then the number of patterens (78 in this case, since total seqience is 78), number of input units (20 in this case, calculating the amino acid composition) and the out puts (1, one value)
SNNS pattern definition files V4.2
Generated at Sat Aug 27 16:40:25 2005
No. of patterns: 78
No. of input units: 20
No. of output units: 1
# Input pattern 1:
0.1 0 0.2 0.2 0 0.1 0 0 0 0 0 0.1 0 0.3 0 0 0 0 0 0
# Output pattern 1:
1
# Input pattern 2:
0.1 0 0 0.5 0 0 0 0 0.1 0.1 0 0 0 0 0.1 0 0 0.1 0 0
# Output pattern 2:
1
Output file of SNNS
The out put file of the SNNS is shown. The result shows the summary of information.
SNNS result file V1.4-3D
Generated at Tue Aug 30 08:58:52 2005
No. of patterns : 26
No. of input units: 20
No. of output units: 1
Startpattern : 1
Endpattern : 26
Input patterns included
Teaching output included
#1.1
0.1 0 0.1 0 0 0 0 0.1 0.1 0.2
![]() 0
0 0 0 0 0.1 0.1 0 0 0.2
0
0 0 0 0 0.1 0.1 0 0 0.2
1
0.64832
#2.1
0 0 0.1 0.1 0.3 0.1 0 0 0 0
0 0 0.2 0.1 0 0 0.1 0 0 0
1
0.6276
The outputs of the SNNS are process at different threshold (0.1 to 1), and parameters like sensitivity, specificity, and accuracy are calculated. The Artificial neural network tries to classify positive from negative examples. For example here we take an example of IgE epitopes and non epitopes. We need a data set of IgE epitope (positive set) and negative set (non epitopes). The Netwok will classify this training set, it will be validated by one set (to stop over fitting) and then tested by the left out testing set. Each set contains equal number of sequence. In five fold cross validation it looks like this,
Training set Validation set Testing set
set 1,2,3 set 4 set 5
set 1,4,5 set 3 set 4
set 1,4,5 set 2 set 3
set 3,4,5 set 1 set 2
set 2,3,4 set 5 set 1
Processing of output data
The out put data are processed and interpreted, as shown (Thres=Threshold; Sen=Sensitivity; Spe= Specificity; Acc=Accuracy; PPV=positive prediction value)
Thres Sen Spe Acc PPV
1.0000 0.0000 0.0000 0.0000 0.0000
0.9000 0.0214 0.9929 0.5071 0.7500
0.8000 0.1429 0.9857 0.5643 0.9091
0.7000 0.2571 0.9571 0.6071 0.8571
0.6000 0.5143 0.8357 0.6750 0.7579
0.5000 0.7214 0.7214 0.7214 0.7214
0.4500 0.8071 0.6000 0.7036 0.6686
0.4000 0.8571 0.4714 0.6643 0.6186
0.3000 0.9571 0.3286 0.6429 0.5877
0.2000 1.0000 0.1000 0.5500 0.5263
0.1000 000 0.0071 0.5036 0.5018
HMMER: Bio-sequences analysis using profile hidden markov models
Introduction
HMMER is a freely distributable implementation of profile HMM software for protein sequence analysis written by Sean Eddy. It is used for sensitive database search using multiple sequence alignments (profile-HMMs) as queries. The profile-HMMs are based on the work of Krogh and colleagues. Basically, we give HMMER a multiple sequence alignment as input; it builds a statistical model called a "hidden Markov model" which you can then use as a query into a sequence database to find (and/or align) additional homologues of the sequence family. HMMER is a console utility ported to every major operating system including different versions of Linux, Windows and Mac OS.
HMMER generally contain following programs ---
hmmalign
Align sequences to an existing model.
hmmbuild
Build a model from a multiple sequence alignment.
hmmcalibrate
Takes an HMM and empirically determines parameters that are used to make searches more sensitive, by calculating more accurate expectation value scores (E-values).
hmmconvert
Convert a model file into different formats, including a compact HMMER 2 binary format, and ``best effort'' emulation of GCG profiles.
hmmemit
Emit sequences probabilistically from a profile HMM.
hmmfetch
Get a single model from an HMM database.
hmmindex
Index an HMM database.
hmmpfam
Search an HMM database for matches to a query sequence.
hmmsearch
Search a sequence database for matches to an HMM.
Memory-Based Learning is a direct descendant of the classical k-Nearest Neighbor (k-NN) approach to classification, which has become known as a powerful pattern classification algorithm for numeric data. In typical NLP learning tasks, however, the focus is on discrete data, very large numbers of examples, and many attributes of differing relevance. Moreover, classification speed is a critical issue in any realistic application of Memory-Based Learning. These constraints demand non-trivial data-structures and speedup optimizations for the core k-NN classifier. Our approach has resulted in an architecture which compresses the typical flat file organization found in straightforward k-NN implementations, into a decision-tree structure. While the decision tree can be used to retrieve the exact k-nearest neighbors (as happens in the IB1 algorithm within TiMBL), it can also be deterministically traversed as in a decision-tree classifier (the method adopted by the IGTREE algorithm). We believe that our optimizations make TiMBL one of the fastest discrete k-NN implementations around.
TiMBL is free software; you can redistribute it and/or modify it under the terms of the GNU General Public License as published by the Free Software Foundation; either version 3 of the License, or (at your option) any later version.
Input file format
2.3, 5.6, 8.9, 4.5, 2.6, 1.2, 4.7, 4.1, 8.2, 2.1, 3.2, 0.5, 4.8, 7.1, 2.6, 3.1, 1.3, 2.3, 4.0, 1.5, +1
5.3, 2.6, 6.4, 5.8, 9.7, 2.5, 1.5, 4.3, 1.0, 2.4, 5.0, 1.3, 3.2, 1.0, 2.1, 3.5, 8.8, 9.2, 1.8, 6.7, –1
4.2, 1.3, 2.0, 1.5, 0.6, 7.0, 9.4, 3.3, 1.6, 8.2, 4.9, 7.8, 2.0, 3.4, 2.1, 3.8, 2.1, 6.4, 9.7, 3.4, +1
3.1, 2.5, 3.2, 1.4, 8.0, 2.4, 6.2, 1.3, 4.9, 5.4, 3.1, 8.3, 4.7, 2.3, 4.9, 2.4, 3.1, 8.3, 2.4, 6.7, –1
5.4, 3.6, 2.8, 3.4, 6.7, 2.4, 1.5, 3.6, 9.8, 7.5, 2.3, 4.6, 1.2, 5.7, 8.9, 3.4, 5.2, 1.3, 4.5, 6.8, +1
Output file format
2.3, 5.6, 8.9, 4.5, 2.6, 1.2, 4.7, 4.1, 8.2, 2.1, 3.2, 0.5, 4.8, 7.1, 2.6, 3.1, 1.3, 2.3, 4.0, 1.5, +1, 5.8
5.3, 2.6, 6.4, 5.8, 9.7, 2.5, 1.5, 4.3, 1.0, 2.4, 5.0, 1.3, 3.2, 1.0, 2.1, 3.5, 8.8, 9.2, 1.8, 6.7, –1, 6.4
4.2, 1.3, 2.0, 1.5, 0.6, 7.0, 9.4, 3.3, 1.6, 8.2, 4.9, 7.8, 2.0, 3.4, 2.1, 3.8, 2.1, 6.4, 9.7, 3.4, +1, 4.3
3.1, 2.5, 3.2, 1.4, 8.0, 2.4, 6.2, 1.3, 4.9, 5.4, 3.1, 8.3, 4.7, 2.3, 4.9, 2.4, 3.1, 8.3, 2.4, 6.7, –1, 6.1
 5.4, 3.6, 2.8, 3.4, 6.7, 2.4,
1.5, 3.6, 9.8, 7.5, 2.3, 4.6, 1.2, 5.7, 8.9, 3.4, 5.2, 1.3, 4.5, 6.8,
5.4, 3.6, 2.8, 3.4, 6.7, 2.4,
1.5, 3.6, 9.8, 7.5, 2.3, 4.6, 1.2, 5.7, 8.9, 3.4, 5.2, 1.3, 4.5, 6.8,
+1, 7.0
Class predicted value
This predicted values use in calculating TP, TN, FP and FN parameters.
TP : True Positive TN : True Negative FP : False Positive FN : False Negative
1. CD-HIT: clustering and comparing large sets of sequences
Introduction
Cd-hit is a fast program for clustering and comparing large sets of protein or nucleotide sequences. The main advantage of this program is its ultra-fast speed. It can be hundreds of times faster than other clustering programs, for example, BLASTCLUST. Therefore it can handle very large databases, like NR. Current CD-HIT package can perform various jobs like clustering a protein database, clustering a DNA/RNA database, comparing two databases (protein or DNA/RNA), generating protein families, and many others.
CD-HIT clusters proteins into clusters that meet a user-defined similarity threshold, usually a sequence identity. Each cluster has one representative sequence. The input is a protein dataset in fasta format and the output are two files: a fasta file of representative sequences and a text file of list of clusters.
Basic command:
cd-hit -i nr -o nr100 -c 1.00 -n 5 -M 2000
cd-hit -i db -o db90 -c 0.9 -n 5, where
db is the filename of input,
db90 is output,
0.9, means 90% identity, is the clustering threshold
5 is the size of word
Choose of word size:
-n 5 for thresholds 0.7 ~ 1.0
-n 4 for thresholds 0.6 ~ 0.7
-n 3 for thresholds 0.5 ~ 0.6
-n 2 for thresholds 0.4 ~ 0.5
CD-HIT-2D
CD-HIT-2D compares 2 protein datasets (db1, db2). It identifies the sequences in db2 that are similar to db1 at a certain threshold. The input are two protein datasets (db1, db2) in fasta format and the output are two files: a fasta file of proteins in db2 that are not similar to db1 and a text file that lists similar sequences between db1 & db2.
Basic command:
cd-hit-2d -i db1 -i2 db2 -o db2novel -c 0.9 -n 5, where
db1 & db2 are inputs,
db2novel is output,
0.9, means 90% identity, is the comparing threshold
5 is the size of word
Please note that by default, I only list matches where sequences in db2 are not longer than sequences in db1. You may use options -S2 or -s2 to overwrite this default. You can also run command:
cd-hit-2d -i db2 -i2 db1 -o db1novel -c 0.9 -n 5
Choose of word size (same as cd-hit):
-n 5 for thresholds 0.7 ~ 1.0
-n 4 for thresholds 0.6 ~ 0.7
-n 3 for thresholds 0.5 ~ 0.6
-n 2 for thresholds 0.4 ~ 0.5
MEME/MAST
MEME: MEME is a tool for discovering motifs in a group of related DNA or protein sequences.
The MEME Suite software is available for FREE interactive use via the web or you can download it on your local system from http://meme.nbcr.net/meme4_1/meme-download.html web link.
MEME takes as input a group of DNA or protein sequences and outputs as many motifs as requested. MEME uses statistical modeling techniques to automatically choose the best width, number of occurrences, and description for each motif.

Program Execution:
meme meme_input_file (options) > meme_output_file
NUMBER OF MOTIFS
-nmotifs <n> The number of *different* motifs to search for. MEME will search for and output <n> motifs. Default: 1
-evt <p> Quit looking for motifs if E-value exceeds <p>.Default: infinite (so by default MEME never quits before -nmotifs <n> have been found.)
NUMBER OF MOTIF OCCURENCES
-nsites <n>
-minsites <n>
-maxsites <n> the (expected) number of occurrences of each motif. If -nsites is given, only that number of occurrences is tried. Otherwise, numbers of occurrences between
-minsites and -maxsites are tried as initial guesses for the number of motif occurrences. These switches are ignored if mod = oops.
Default: -minsites sqrt (number sequences)
-wnsites <n> the weight on the prior on nsites. This controls how strong the bias towards motifs with exactly nsites sites (or between minsites and maxsites sites) is. It is a number in the range [0..1). The larger it is, the stronger the bias towards motifs with exactly nsites occurrences is. Default: 0.8
MOTIF WIDTH
-w <n>
-minw <n>
-maxw <n>
The width of the motif(s) to search for. If -w is given, only that width is tried. Otherwise, widths between -minw and -maxw are tried. Default: -minw 8, -maxw 50 (defined in user.h)
Note: If <n> is less than the length of the shortest sequence in the dataset, <n> is reset by MEME to that value.
MAST: MAST is a tool for searching biological sequence databases for sequences that contain one or more of a group of known motifs.
MAST takes as input a MEME output file containing the descriptions of one or more motifs and searches a sequence database that you select for sequences that match the motifs
mast <meme_output_file> [-d <database>] [optional arguments ...]
<mfile> file containing motifs to use (meme_output_file)
-d database to search with motifs
The contribution of each residue (amino acid) for each position in a polypeptide chain can be calculated with the use of Quantitative matrix. The QM is basically a propensity of each residue at a particular position. There are a number of equations, which can be used for matrix generation. The higher positive score of a residue at a given position means this residue is highly preferred at that position. The higher negative score means that residue is not preferred in peptides at that position. One of the major advantages of QM is that the effect of each residue on specific activity of a peptide can be easily estimated.
Quantitative Matrix: These quantitative based methods consider the contribution of each residue at each position in peptide instead of anchor positions/residues. Quantitative matrices provide a linear model with easy to implement capabilities. Another advantage of using the matrix approach is that it covers a wider range of peptides with binding potential and it gives a quantitative score to each peptide. Their predictive accuracies are considerable.
Equation for Matrix Generation: There are a number of equations which can be used for matrix generation.
A few of which are as follows
Q (i,r) = P(i,r) – N(i,r) (1)
P (i,r) = E i,r / NP i,r (2)
N (i,r) = A i,r / NN i,r (3)
Where, Q(i,r) is the weight of any residue r at position 'i' in the matrix. 'r' can be any natural amino acid and the value of 'i' can vary from 1 to 15. P(i,r) and N(i,r) is the probability of residue 'r' at position 'i' in positive and negative peptides respectively. E i,r and A i,r is number residue 'r' at position 'i' in positive and negative peptides respectively, and NP i,r is the number of positive peptides and NN i,r is the number of negative peptides having residue 'r' at position 'i'.
Example:
Generation of Quantitative matrices: The quantitative matrices consist of a table having the sequence weight
Frequencies of each of the 21 amino acids (including "X") at each position in the dataset of MHC binders divided by the corresponding expected frequency of that amino acid in the non-binders dataset. The MHC binder’s datasets for each MHC allele are generated by obtaining MHC binders of 9 amino acids from MHCBN database. The equal number of the non-binders is also obtained from the same database (if available) otherwise the 9-mer peptides are randomly chosen from the SWISS-PROT database. The quantitative matrices are addition matrices where the score of a peptide is calculated by summing up the scores of each residue at specific position along peptide sequence. For example, the score of peptide "ILKEPVHGV" is calculated as follows.
Score= I(1)+L(2)+K(3)+E(4)+P(5)+V(6)+H(7)+G(8)+V(9)
The peptides with score more than the cutoff score at a particular threshold are predicted as MHC binders. A fewmatrices are also obtained from literature (BIMAS and ProPred1).These matrices are mostly multiplication matrices. The score of the peptide is calculated as follows: e.g. "ILKEPVHGV"
Peptide score=I(1)*L(2)*K(3)*E(4)*P(5)*V(6)*H(7)*G(8)*V(9)