Output Format
Graphical Format
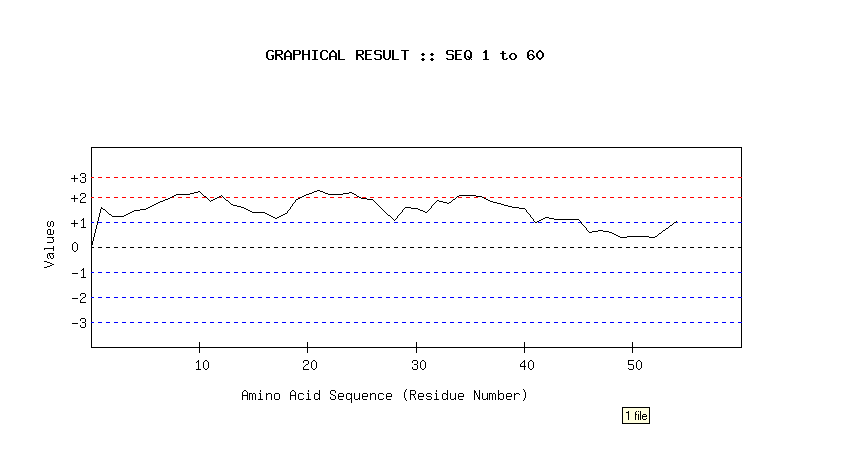
- The mean value of the seven residues is assigned to the center of the window and is placed on a graph where abscissa represents the protein sequence and the ordinate represents the average propensity of the amino acid according to a particular scale.
- The graph uses a scale normalized between +3 to -3.
- High values will give rise to peaks, whereas valleys will correspond to negative properties of the protein.
- The peak of the amino acid residue segment (considering the window length) above the threshold value (2 to 2.5) is considered as predicted B cell epitope.
Tabular Format
- Each amino acid of the peptides are dispalyed with the corresponding normalized score.
- The normalized score of the propensity of the amino acid according to a particular scale ranges form +3 to -3.
- The normalized score of amino acid residue segment (considering the window length) above the threshold value ( 2 to 2.5) is considered as predicted B cell epitope.
TABULAR RESULT
For single physico-chemical property.
The score above the threshold value will be diplayed in blue color.
      Parameter

  AA   Hydro

  A:   1.585
  S:   1.221
  D:   0.994
  F:   0.860
  A:   1.058
  c:   2.567
  S:   1.900
  E:   1.885
OVERLAP DISPLAY
In overlap display, consensus prediction of two or more physico-chemical properties are displayed. Predicted epitope regions are shown in blue color.


