
| ccPDB: Analysis is a extension module of ccPDB. The module is able to compare the amino acids involved in interaction and non-interaction of a particular ligand. The module can also compare the interacting amino acids of a group of ligands (e.g. ATP,GTP,NAD,FAD,FMN ( a group of nucleotides) as shown in home page graph).This type of study helps in finding strong binders (amino acids interacting more with a ligand as compare to other amino acids) and weak binders (amino acids interacting less with a ligand as compare to other amino acids). This type of knowledge helps in modulating the efficiency of active site interaction with ligand..
|
This module shows the percent composition of amino acids interacting with the given ligand. Type the 3/2 letter code of the ligand in the box, then select the interaction distance between the ligand and the interacting amino acid. User can also define the Contact surface area between the ligand and the interacting amino acid. There are four type of bonds in option that are: HB = hydrogen bond, Arom = aromatic interaction. Phob = hydrophobic interaction, DC = destablizing interaction.
Go to Top
This module shows the percent composition of amino acids interacting with the given ligand vs the amino acid that are non-interacting with the given ligand. e.g. in a sequence QKPvVNTAYGRVrGVRRELNneILGPVV, the amino acids in small letter are interacting with the given ligand and amino acids in Capital letter are non-interacting.
Go to Top
Options are same as decribed above. This module shows the percent composition of amino acids interacting with the a given ligand vs the percent composition of amino acids interacting with the another ligands. e.g. comparison of percent composition of amino acids interacting with APE,APF,APG,APH. A maximum of five ligands can selected in one time. if you selected more than five ligands, only the first five ligands will be selected.
Go to Top
How to save and pritn the graph

The graph shows the percent composition of 20 amino acids which are interacting with a given ligand in the Protein data bank (PDB). Data is obtained from ccPDB. Mouse hover the bar to view the value of data.
Go to Top
The graph shows the percent composition of 20 amino acids which are interacting with a given ligand in the Protein data bank (PDB). Data is obtained from ccPDB. In case on Ligand interacting and non-interacting amino acids option, two bars will be made, blue bar show the data of amino acids interacting with the ligand and red bar shows the amino acids that are not interacting with the ligand in the same PDB. The green line shows the average of interacting and non-interacting amino acids. The pie chart shows the number of total interaction of ligand and total non-interaction of the ligand. A sample case is shown below.
 Go to Top
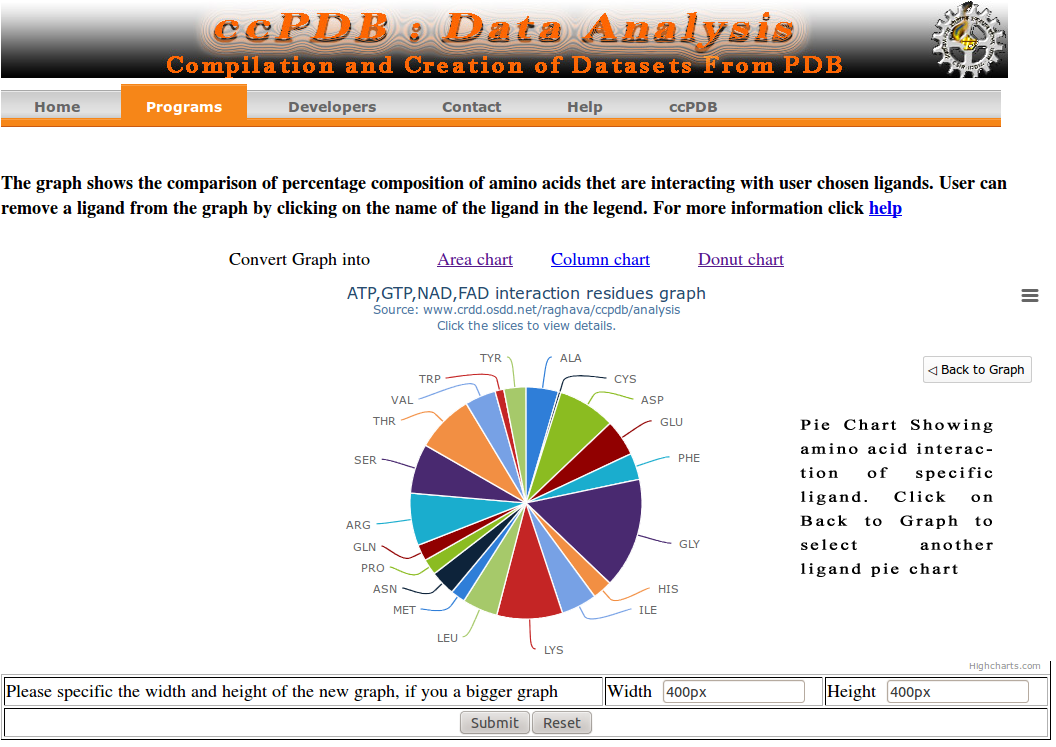
The graph shows the percent composition of 20 amino acids which are interacting with a number of ligands in the Protein data bank (PDB). Data is obtained from ccPDB. Three are three types of graphs : Area chart, Column chart, Donut chart. Area chart shows the comparison data in a area type graph. Mouse hover a amino acids will show the values. Last ligand in the list is shown in front of graph and first ligand in the list is shown in back of graph. User can add and remove the ligands from the graph by clicking on the ligand name in the legend area as shown in below graphs. User can also increase the size of the graph by changing the values in width and height box, a ample is shown below. A sample case is shown below.


 Go to Top