
Algorithm of HemoPI |
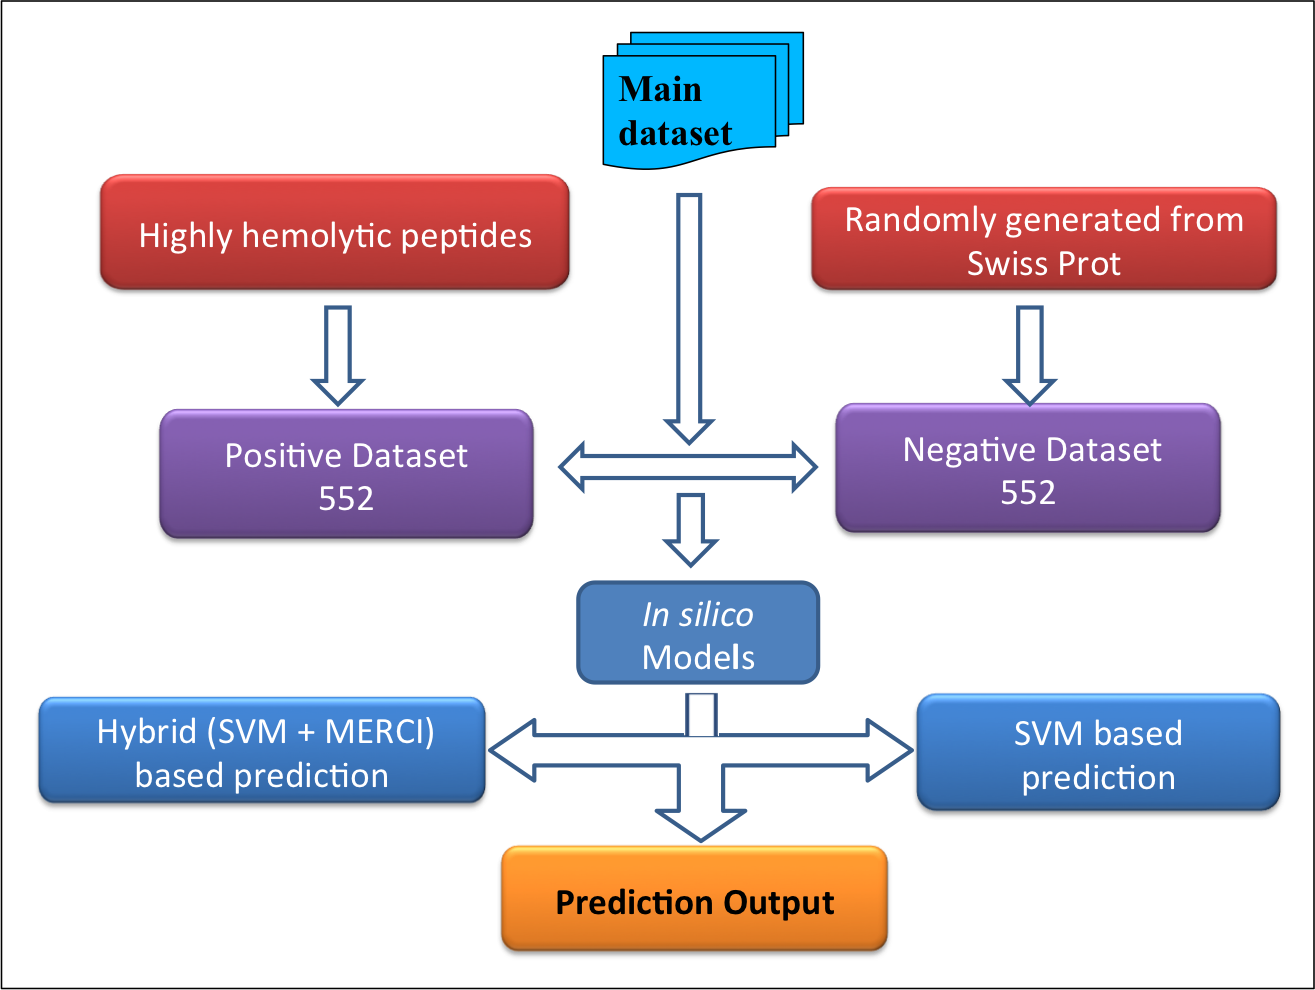
Datasets-The datasets were derived mainly from Hemolytik database. We have developed two following datasets:Main dataset-This comprises of 552 experimentally validated highly hemolytic peptide sequences from Hemolytik Database as positive dataset and same number of peptide sequences randomly generated fron SwissProt as negative dataset as shown in following figure. |
|
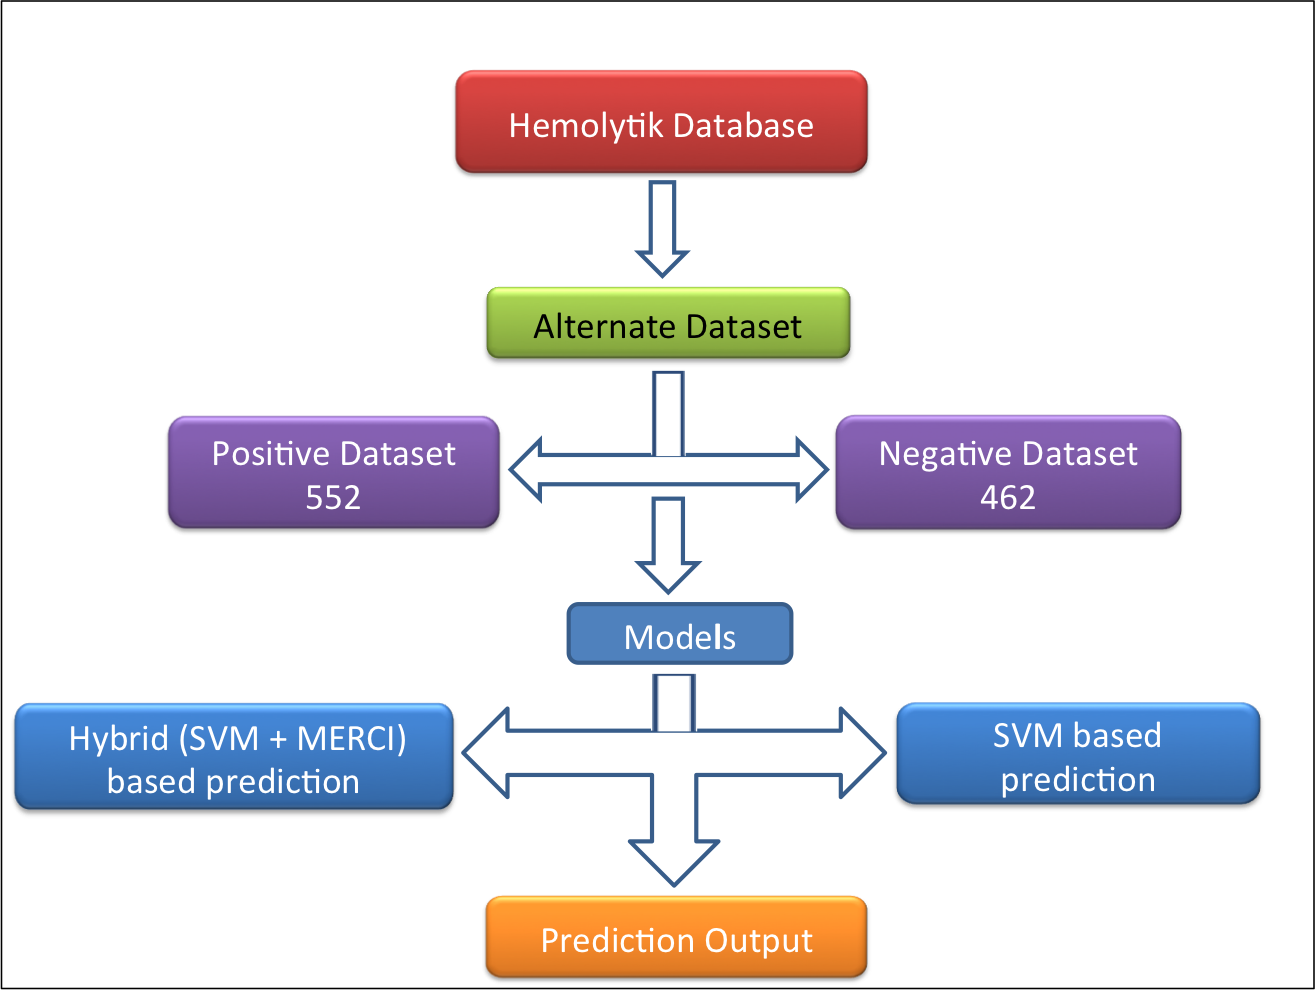
Alternative dataset-In this dataset (alternate dataset), 552 experimentally validated highly hemolytic peptides were taken as positive examples and 462 experimentally validated non-hemolytic/poor hemolytic peptides (i.e. peptides having IC50>200uM, <10% hemolysis at 100 or >100uM concentration and MHC >500uM) were taken as negative example as shown in following figure. |
|
| The algorithm of HemoPI is based on the following models: |
Motif based model |
| A number of motifs were observed in hemolytic peptides. Therefore, we used this information for differentiating between hemolytic peptides and non-hemolytic peptides. These motifs were used for distinguishing hemolytic peptides from non-hemolytic peptides. |
Hybrid approach (Motif and SVM)To increase the robustness of prediction, we used the hybrid model by integrating motif based and SVM based methods. If the user's query peptide has the any one of the motifs as those from our datasets, we assign peptide type to it based on motif that it contains. SVM model of prediction is used in case no motif is found. |
| Hydrophobicity | EISD840101 |
| Hydrophilicity | HOPT810101 |
| Steric Hinderance | CHAM810101 |
| Net Hydrogen | FAUJ880109 |
| Solvation | EISD860101 |
| Charge | KLEP840101 |
| Hydropathy | KYTJ820101 |
| Amphiphilicity | MITS020101 |
| Weight | FASG760101 |
| Amount of Hemolysis | Concentration of peptide tested |
|---|---|
| ≥ 5% | ≤10µM |
| ≥ 10% | ≤ 20µM |
| ≥ 15% | ≤ 50µM |
| ≥ 20% | ≤ 100µM |
| ≥ 30% | ≤ 200µM |
| ≥ 50% | ≤ 300µM |
| MHC | ≤ 50µM |
| Removed peptides with hemolysis between 0-5%, which have been tested at concentration < 5µM | |
| Borderline cases, which do not follow these rules have been removed. | |
| Amount of Hemolysis | Concentration of peptide tested |
|---|---|
| ≤ 2% | ≥ 10µM |
| ≤5% | ≥ 20µM |
| ≤ 10% | ≥ 50µM |
| ≤ 15% | ≥ 100µM |
| ≤ 20% | ≥ 200 µM |
| ≤ 30% | ≥ 300µM |
| ≤ 50% | ≥ 500µM |
| MHC | ≥ 100µM |
Help about HemoPI |
| This section helps the user to get the details of all the modules with explanatory text and supportive figures. User can directly go to the particular section by clicking on the names of the modules below. |
| Hemolytic Potency | Virtual Screening |
|---|---|
| Protein Mapping | Q. Matrices |
| Hemolytic Potency |
| This module helps the users to predict the hemolytic potency of peptides and design peptides with the option to increase/decrease hemolytic potency of the peptide.Further mutants are generated of the original peptide and also physiochemical properties are displayed according to the user's choice. |


1.To predict hemolytic potency type or paste peptide sequence.
2.Choose the prediction model
3.Select the physiochemical properties to be predicted.
4.Click the Run Analysis button to submit query.
5.Displays the prediction results for query peptide.
6.Displays the probablity score of the peptide and its mutants.
7.Shows all possible single position mutants along with their probability score and physicochemical properties.
| Virtual Screening |
| This tool helps the users to submit multiple peptides as a single query in single fasta format.This module will help the user to choose best peptide from batch of peptides.Mutants of each peptide and their physiochemical properties are displayed accordingly. |


1.Type or paste peptide sequences and choose the prediction model.
2.Select the physiochemical properties to be predicted.
3.Click the Run Analysis button to submit query.
4.Displays the original peptides.
5.Displays the sortable physiochemical properties.
6.Displays the original peptide.
7.Displays the physiochemical properties.
8.Red colour displays the position of mutation.
| Protein Mapping |
| This module helps the users to scan the hemolytic region from the protein sequence.The user can select the peptide fragment length and then all possible overlapping peptides are generated and further their mutants along with svm score are displayed.Here results are displayed in two forms a)Tabular form b)Graphical form. |


1.Type or paste protein sequence.
2.Select peptide fragment length for which all possible overlapping peptides will be generated and select the prediction model.
3.Select the physiochemical properties to be predicted.
4.Displays the original query peptide.
5.Displays the overlapping peptides
6.Original sequence of whole protein .
7.Graphical representation of results for whole protein.
8.Click to see graphical results of overlapping peptide fragment
| Quantitative Matrices |
| This tool represents quantitative matrix generated on the basis of relative frequency of each amino acid at every position (1-30).Quantitative matrix is displayed for each data set, with monopeptide , dipeptide amino acid composition and physiochemical properties. |

1.Select the type of quantitative matrix to be displayed
2.List of amino acid
3.Position of each residue