| |
HLP: A webserver for predicting half-life of peptides in intestine like environment |
| Home | Submit: Peptide, Protein, Batch | Data sets | Algorithm | Help | Links | Team | Contact us |
Predict peptide half-life and antibacterial activity in batch mode.
Simultaneously, a number of peptides can be submitted to predict their half-life and antibacterial activity.
Algorithm UsedStatistics of Dataset Used in Model DevelopmentThe following table show statistics of the peptide sequences used during the development of half-life prediction models. A total of 189 peptides were used for the development of 10mer and 186 peptides were used for the development of 16mer half-life prediction model.
Performance of Models Used on HLP webserver(a) Performance of SVM based Models Used on HLP webserver
(b) Performance of WEKA based Models Used on HLP webserver
For more details on results, please go to manuscript. Overview of Procedure for SVM and WEKA based Model DevelopmentFirst of all, 10mer and 16mer peptide sequences accompanied with their half-life values (in seconds) were extracted from Table S2 (Click to see) of Supporting Information provided by Gorris et al (2009). Peptide sequences (10mer / 16mer) were used to calculate amino acid, dipeptide, tripeptide percentage compositions and binary patterns to be used as input vectors for SVMlight and WEKA software. In order to avoid any mismatch between peptide sequence and half-life, their Half-life values were kept linked with them during the whole process of calculation. These input vectors were used one by one to develop various SVM and WEKA based models. The five fold cross-validation technique was implemented to evaluate the performance of developed models in terms of Pearson's correlation coefficient (R), Coefficient of determination (R2) and Mean Absolute Error (MAE). Best performing 10mer and 16mer half-life prediction models have been used on HLP webserver. The pictorial representation of the whole process is as given below:Figure 1: Flow chart showing methods used for developing peptide half-life prediction models. 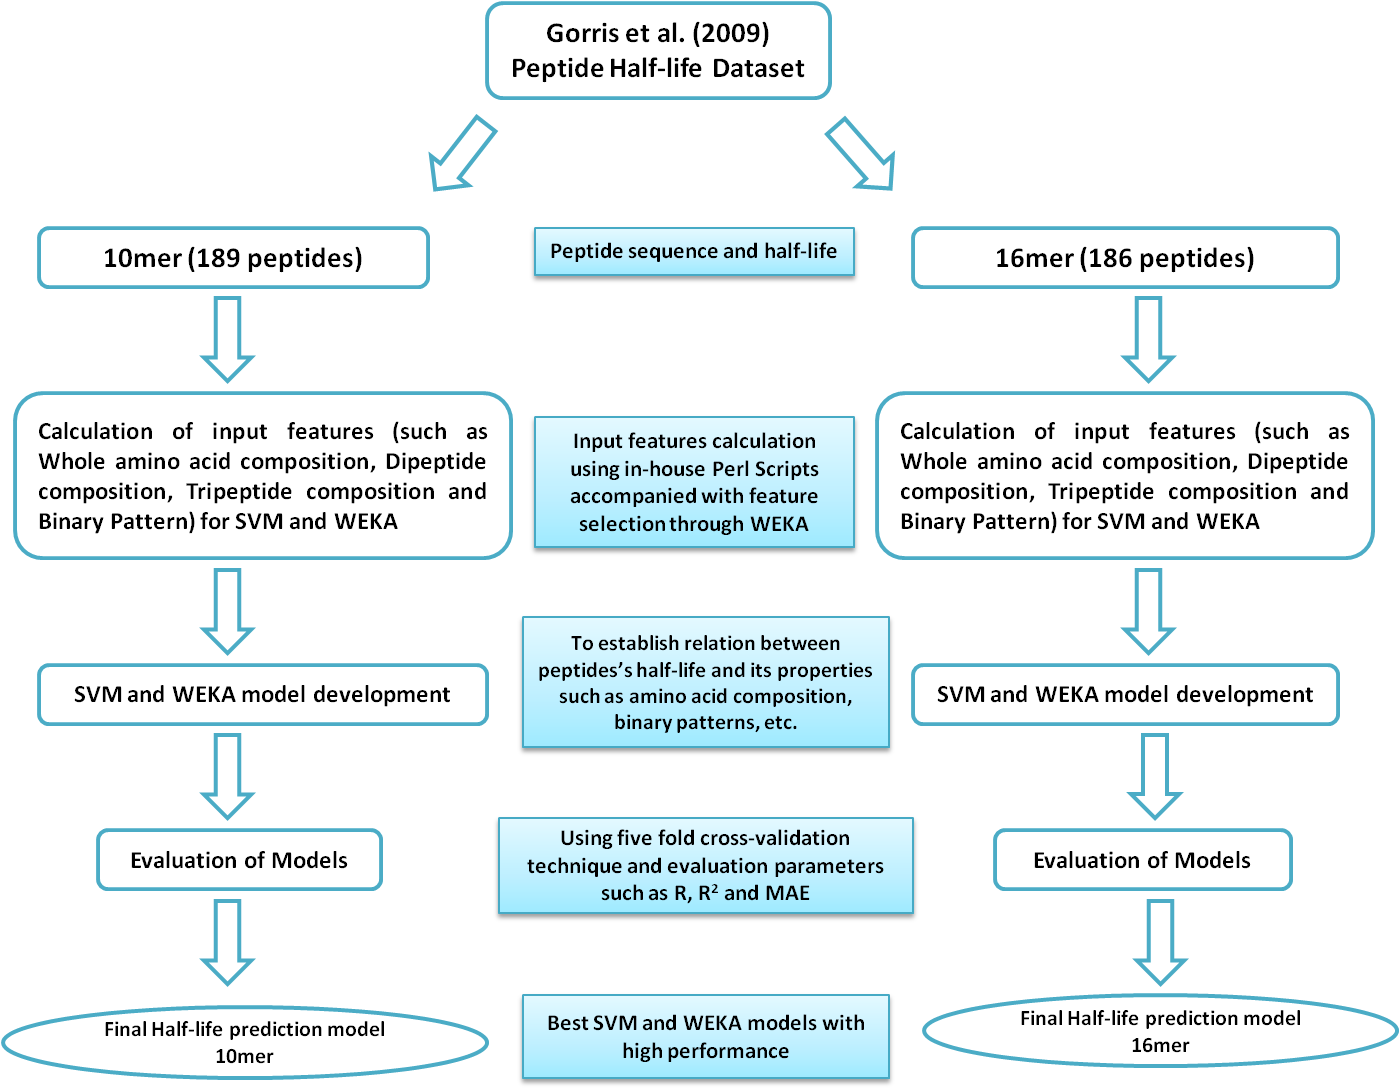
Detailed Description of Procedure for SVM based Model DevelopmentFigure 2 represents the detailed description of steps followed during the development of best performing SVM based half-life prediction models 10mer and 16mer.(A) Preparation of Input files for svm_learn: To develop these SVM based models, peptide sequences (10mer / 16mer) were used as input to our in-house Perl scripts to calculate input features (such as amino acid, dipeptide, tripeptide % composition and binary pattern) for SVMlight's svm_learn binary (a software used to develop SVM based models). We are taking amino acid composition and half-ife containing file as example file for developing SVM model. This file is randomly divided into five equal parts known as Set 1 to Set 5. Figure 2: Flow chart showing methods used for developing SVM based peptide half-life prediction models. 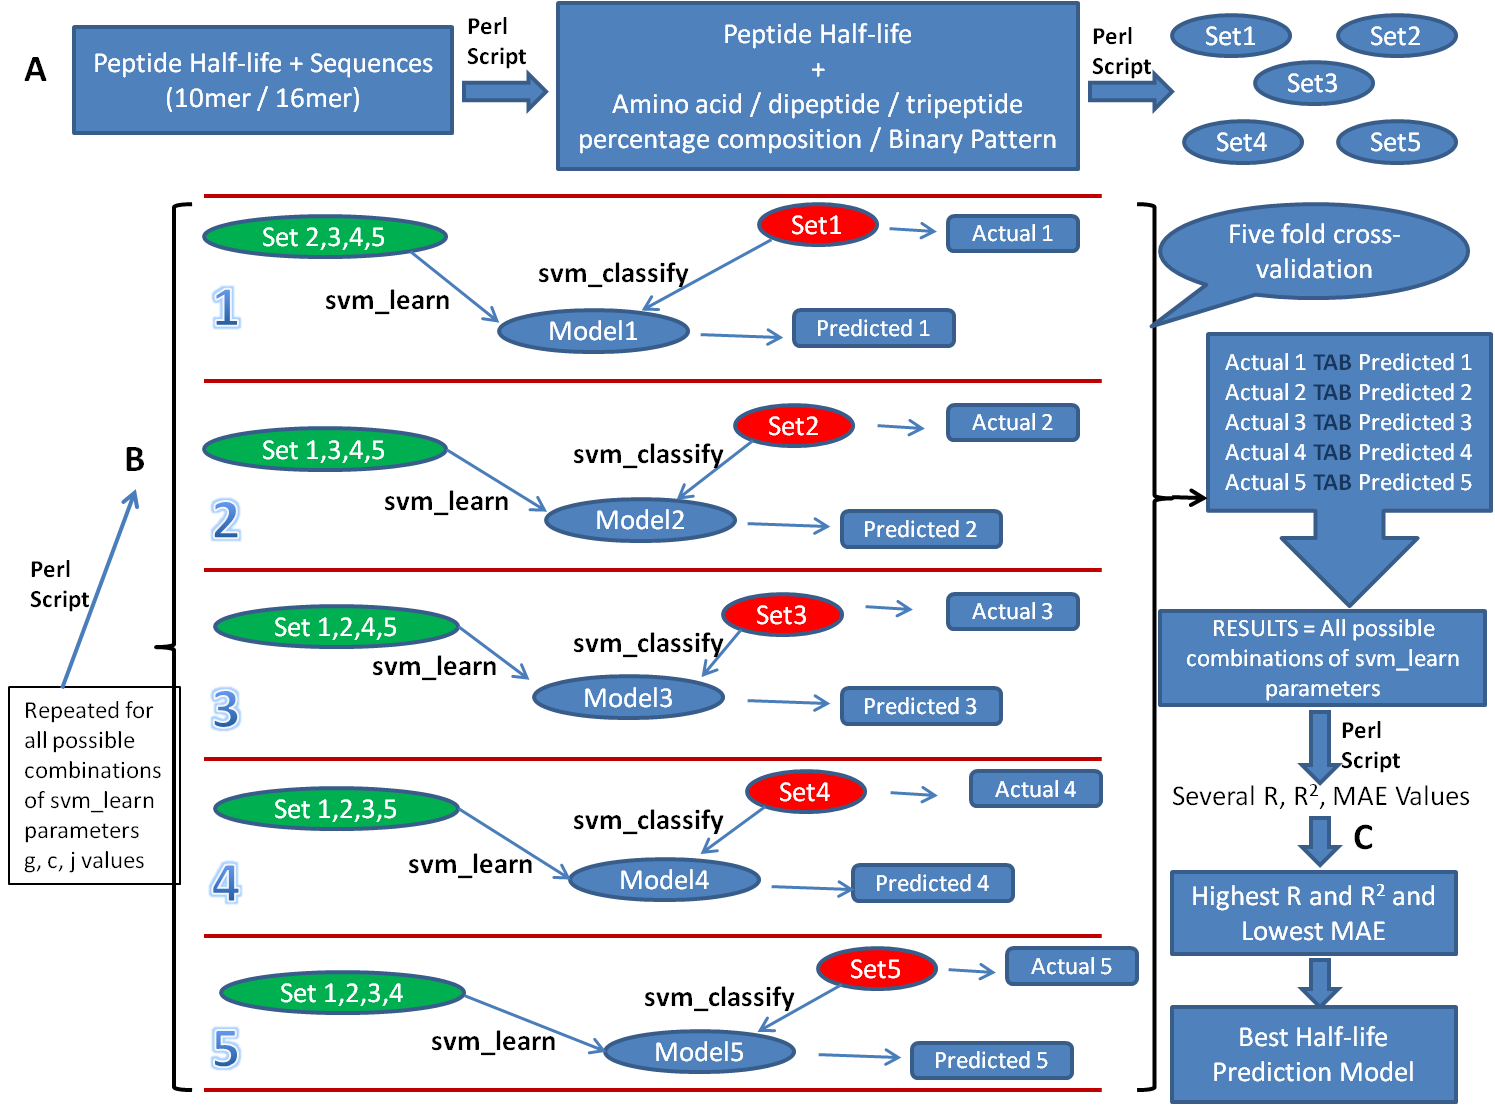
(B) (I) Using "svm_learn" and "svm_classify" to develop SVM based models: As per documentation of SVMlight, svm_learn can be used in four modes mainly i.e., classification (-z c) / regression (-z r) / preference ranking (-z p) mode and can make use of linear (-t 0) / polynomial (-t 1) / radial basis function (-t 2) / sigmoid (-t 3) / user defined kernel from kernel.h (-t 4) as kernels. User may run "svm_learn -" on their Linux terminal to check list of available options. In present study, svm_learn was run in regression mode (-z r). Using RBF (-t 2) kernel and various available parameters for this kernel (such as g = 1, 0.1, 0.01, 0.001, 0.0001; c = 1, 2, 3, 4, 5, 6, 7, 8, 9, 10; j = 1, 2, 3, 4, 5), svm_learn develops Model 1 to 5 making the use of training sets (green colored sets). Example command to run svm_learn to generate Model 1 (using parameters g=1,c=1,j=1) is: svm_learn -z r -t 2 -g 1 -c 1 -j 1 Training_set_1 Model1 (II) Using "svm_classify" to predict half-life of peptides: As depicted in figure, svm_classify uses Model 1 to 5 for different Test sets (red colored sets) to provide Predicted 1 to 5 files (contains predicted half-life for respective Test set peptides). Extracting half-lives from Test sets (red colored sets) makes Actual 1 to 5 files (contains actual half-life for peptides present in test sets). The actual and predicted half-life containg files are pasted in single file called RESULTS. Thus, RESULTS contains tab-separated, adjacently placed, actual and predicted half-life values for Test sets 1 to 5 (red colored). The RESULTS file is used by our in-house Perl script to calculate Pearson's correlation coefficient (R), coefficient of determination (R2) and mean absolute error (MAE) between actual and predicted half-life values. Example command to run svm_classify on Model1 is: svm_classify Test_set_1 Model1 Result_1" (C) The entire process mentioned in step (B) is repeated for all possible combinations of parameters to retrieve several R, R2 and MAE values. The highest R, R2 and least MAE containing models have been used on HLP webserver. Calculation of Physicochemical Properties for PeptidesAny physicochemical property value for user submitted / protein dervied / mutant peptides is being calculated as the sum of value of that property for an individual amino acids (from starting residue to full length of a particular peptide) except for isoelectric point (pI) where average of isoelectric point values for individual amino acids is taken. The sources of physicochemical property values for individual amino acids (used for the calculation of physicochemical properties of peptides) are given below:
Scanning of Protein to Generate PeptidesFigure 3: Diagram showing generation of overlapping peptides (10mer) from a protein sequence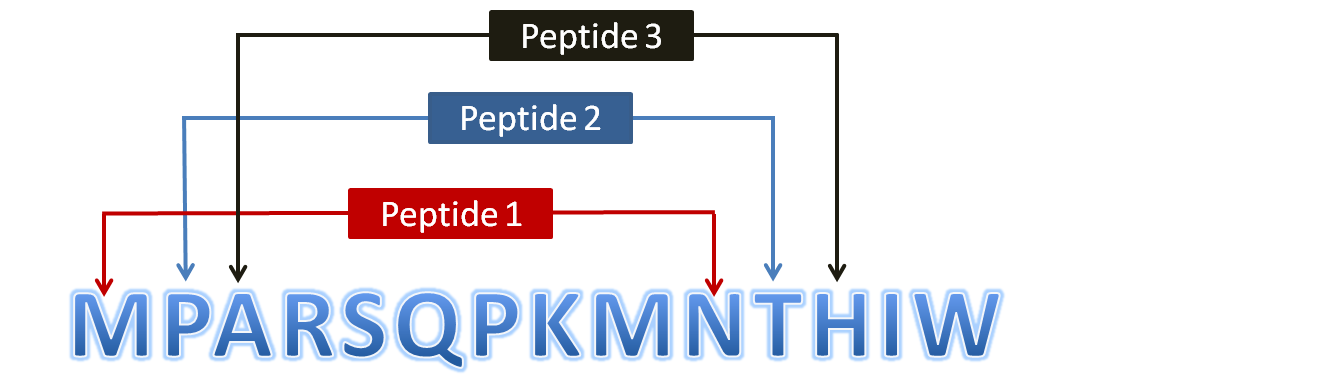
Input Features for SVMlight and WEKAAmino acid composition and dipeptide composition were used as input features for SVM and WEKA based model development. The amino acid composition is fraction of each amino acid in a peptide and converts a peptide sequence to a vector of 20 dimensions. The dipeptide composition in a peptide is the percentage of the different adjacent pairs of amino acids represented in a particular peptide. Dipeptide composition converts a peptide sequence to a vector of 400 dimensions and helps encapsulating the properties of the neighboring amino acids. The tripeptide composition in a peptide is the percentage of the three adjacent amino acids represented in a particular peptide. Tripeptide composition converts a peptide sequence to a vector of 8000 dimensions and helps encapsulating the properties of the neighboring amino acids.
Where (i) is any amino acid. Binary Pattern: Each amino acid of a peptide is represented by binary pattern of 20, where 1's represents the presence of concerned amino acid at that position and 0's for the absence of other 19 amino acids (e.g. Ala is represented by 1,0,0,0,0,0,0,0,0,0,0,0,0,0,0,0,0,0,0,0). Thus, a vector of dimension N X 20 is used to represent the peptide of length N (size of peptide). SVMThe SVM was implemented using freely downloadable software package SVM_light written by Joachims (Joachims 1999). The software enables the user to define a number of parameters as well as to select from a choice of inbuilt kernel functions, including a radial basis function (RBF) and a polynomial kernel.WEKAIn this study IBk, DecisionTable based algorithm implemented in Weka package has also been used to predict half life of 10mer, 16mer peptides respectively.Evaluation of SVM and WEKA based Models PerformanceThe performance of models constructed in this study was evaluated using a 5-fold cross-validation technique. In the 5-fold cross-validation, the relevant dataset was partitioned randomly into five equally sized sets. The training and testing was carried out five times, each time using one distinct set for testing and the remaining four sets for training. The performance of the models was computed using Pearson's Correlation Coefficient (R), Coefficient of determination (R2) and mead absolute error (MAE) formulae as given below:Where yi and xi represent predicted and actual half-life values for ith peptide. N is total number of peptides. SD is the sum of the squared deviations between the activities of the test set and mean activities of the training peptides. Results SummeryIn conclusion, SVM based models developed on 10mer dataset have achieved maximum correlation R/R2 0.57/0.32, 0.68/0.46, and 0.69/0.47 using amino acid, dipeptide and tripeptide composition respectively. The models developed on 16mer dataset have showed maximum R/R2 0.91/0.82, 0.90/0.39, and 0.90/0.31 using amino acid, dipeptide and tripeptide composition respectively. Furthermore, models developed (using WEKA) on selected dipeptides have achieved correlation (R) 0.70 and 0.98 on 10mer and 16mer dataset respectively. |
|||||||||||||||||||||||||||||||||||||||||||||||||||||||||||||||||||||||||||||||||||||||||||||||||||||||||||||||||||||||