|
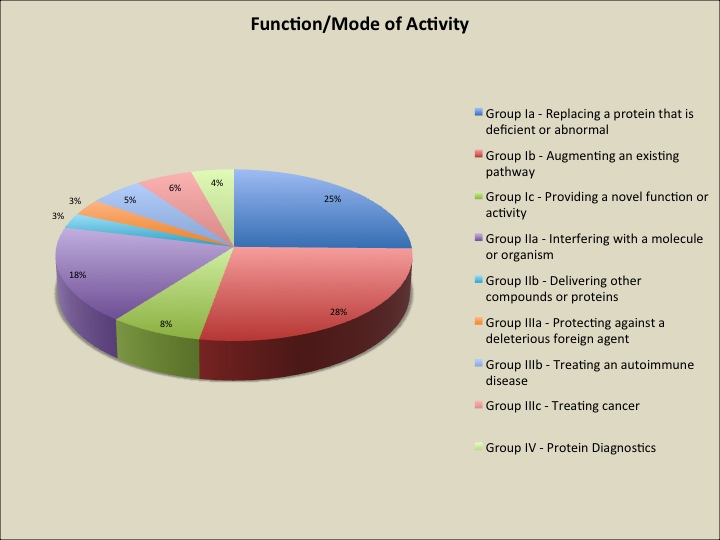
Figure 1: Represent the percentage distribution of coressponding therapeutic peptide and protein based drug on the basis of their functions.
|
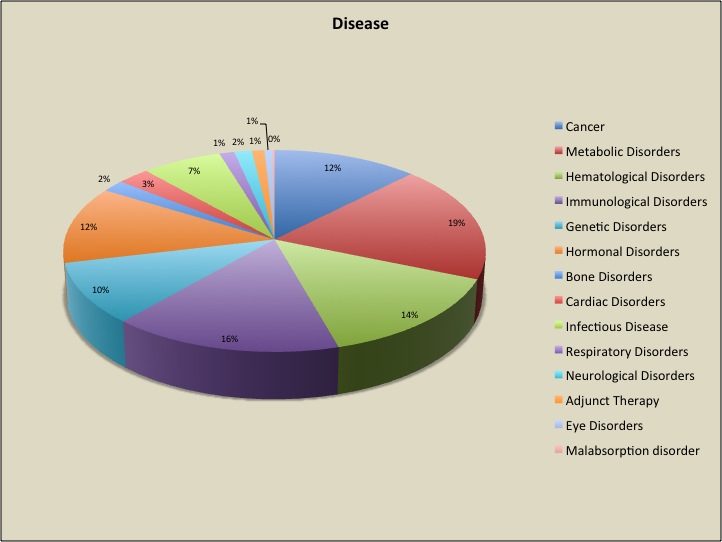
Figure 2: Represent the disease based percentage distribution of coressponding therapeutic peptides and proteins.
|
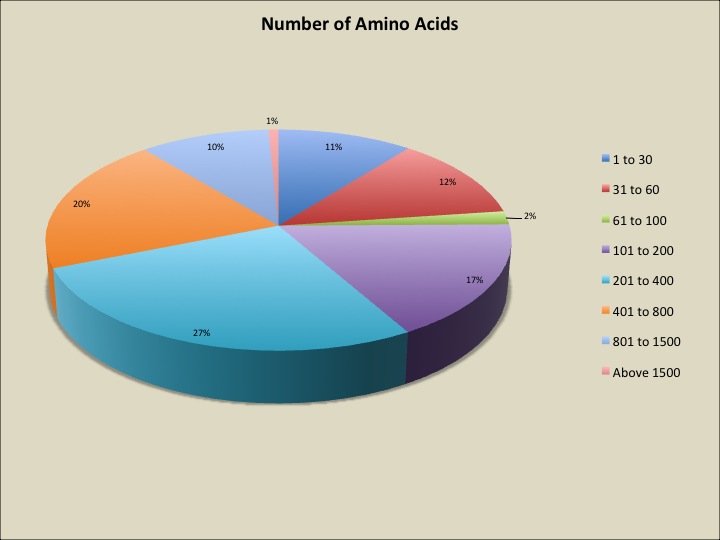
Figure 3: Represent the percentage distribution of therapeutic peptides and proteins on the basis total amino acid residues.
|
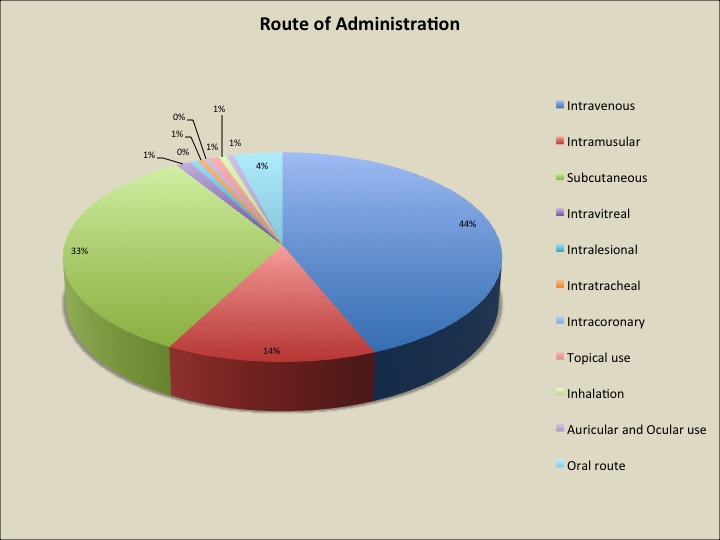
Figure 4: Represent the percentage distribution of coressponding therapeutic peptides and proteins based drugs on the basis route of administration.
|
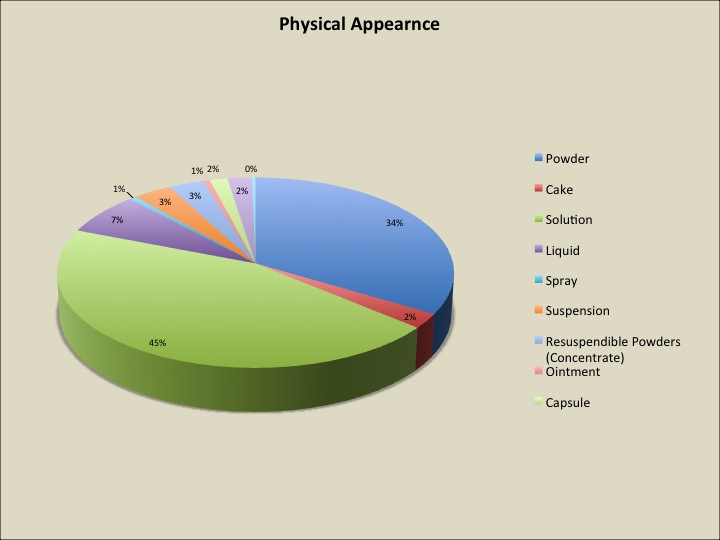
Figure 5: Represent the physical appaearance or form based percentage distribution of coressponding therapeutic peptides and proteins based drugs.
|
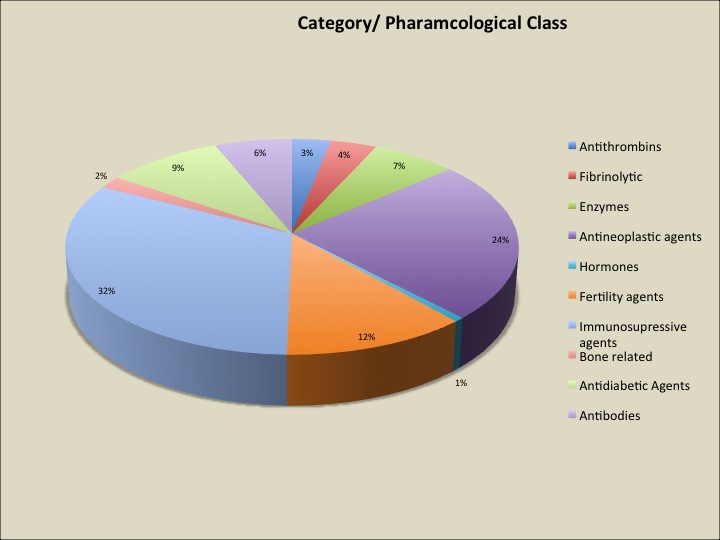
Figure 6: Represent the categorised percentage distribution of therapeutic peptides and proteins.
|
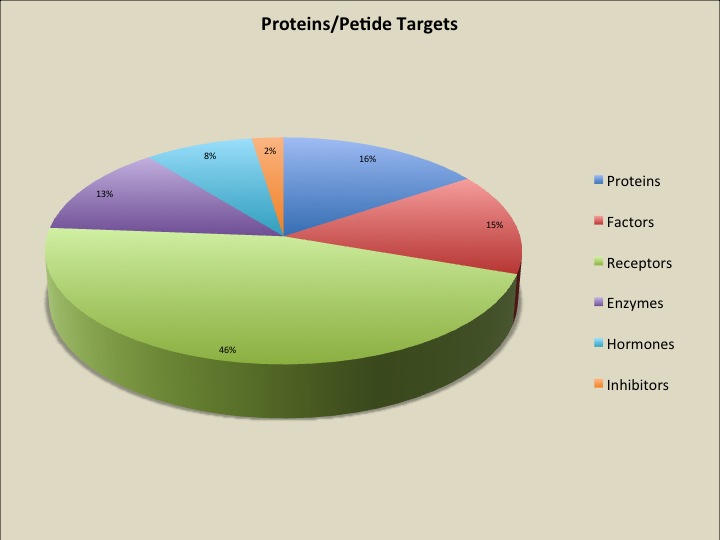
Figure 7: Represent the percentage distribution of therapeutic peptides and proteins on the basis of thier target.